

Friability Formula Guide: Calculate Tablet Durability
Do you have full confidence that your tablets will arrive in the patient's hands intact? The friability test formula is the primary method for confirming physical strength against the bumps and grinds of shipping.
For managers in Quality Control, applying this calculation correctly guarantees your batches meet global compliance standards like USP <1216>. It is a proven, straightforward process used in laboratories everywhere. Here is a practical guide to the math, typical slip-ups to avoid, and how to ensure your production consistently makes the grade.
Key Takeaways
- Calculate Durability Accurately: The friability formula measures the percentage of weight lost to friction. It is the primary method for confirming tablets can survive the supply chain.
- Follow USP <1216> Standards: Compliance requires precise settings. You must set the drum speed to exactly 25 RPM and usually run the test for 100 rotations or four minutes.
- Know the Pass/Fail Limit: For most compressed tablets, losing more than 1.0% of the total weight counts as a failure. Any visible cracking or capping also means the batch is rejected.
- Automate for Consistency: Manual errors in counting or weighing can skew results. Advanced equipment like the ToronFRI series automates discharge and calculations to ensure reliable data every time.
What Does the Friability Test Measure?
Friability refers to the tendency of a tablet to chip, break, or shed particles when subjected to mechanical stress. While tablet hardness measures resistance to crushing, friability tells you how tablets hold up under repeated contact and movement.
Read more: Tablet Hardness and Friability: What is the Difference?
During the test, tablets tumble inside a rotating drum to simulate real-world stress. The weight difference before and after gives you the loss — and that’s where the formula comes in.
This is especially important for uncoated or compressed tablets, which are more exposed to handling conditions.
Related article: Friability Test in the Pharmaceutical Industry
The Standard Friability Test Formula
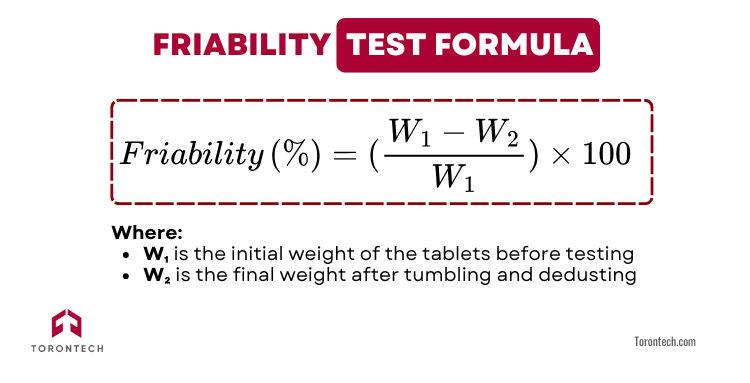
To calculate how much weight your tablets lose after mechanical stress, you’ll use this friability test formula:
Friability (%) = ((W₁ - W₂) / W₁) × 100
Here’s what each part means:
- W₁ is the initial weight of the tablets before testing
- W₂ is the final weight after tumbling and dedusting
This formula gives you the percentage of weight lost — a direct reflection of how well your tablets can handle motion, impact, and handling during packaging or shipping.
How to Prepare the Sample
If your tablets weigh 650 mg or less, you should select a sample totaling 6.5 grams (for example, around 13 tablets at 500 mg each). For heavier tablets, use 10 whole units.
Make sure the tablets are clean and free of dust before the initial weighing. After that, you’ll place them into the friabilator.
The Test Procedure You’ll Follow
Run the test at 25 rpm for 100 rotations, which takes about 4 minutes. When it's done, remove the tablets, gently dedust them again, and record the final weight. Plug both values into the formula to find your friability percentage.
When Is the Result Acceptable?
If the weight loss is 1.0% or less, your tablets pass. But there’s one exception: even if the percentage looks good, any visible cracks, chips, or broken pieces mean the test fails. So always check the tablets closely before confirming results.
Real Examples to Help You Understand
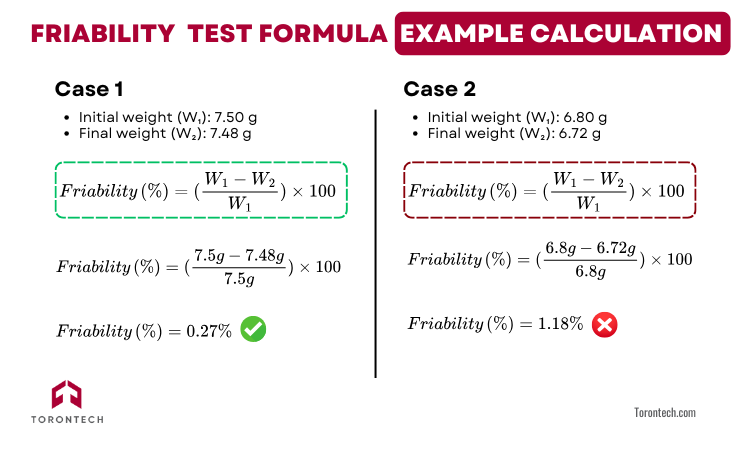
Once you’ve run the test and collected the before-and-after weights, using the friability test formula becomes very straightforward. You’re simply calculating how much weight your tablets lost during the tumbling process and that tells you how well they hold up under mechanical stress.
Let’s walk through a few realistic scenarios so you can apply this confidently.
1. Clear Pass Example
- Initial weight (W₁): 7.50 g
- Final weight (W₂): 7.48 g
Friability (%) = ((7.50 - 7.48) / 7.50) × 100 = 0.27%
Result: Pass → The weight loss is below 1%, which means your tablets meet the standard requirement.
2. Above the Limit Example
- Initial weight (W₁): 6.80 g
- Final weight (W₂): 6.72 g
Friability (%) = ((6.80 - 6.72) / 6.80) × 100 ≈ 1.18%
Result: Fail → Since this is over the 1% limit, the batch would be rejected unless a retest averages out to an acceptable value.
3. Low Loss, Reliable Result Example
- Initial weight (W₁): 8.00 g
- Final weight (W₂): 7.98 g
Friability (%) = ((8.00 - 7.98) / 8.00) × 100 = 0.25%
Result: Pass → Excellent result showing very little abrasion.
4. Borderline Outcome Example
- Initial weight (W₁): 10.00 g
- Final weight (W₂): 9.89 g
Friability (%) = ((10.00 - 9.89) / 10.00) × 100 = 1.10%
Result: Conditional Fail → This slightly exceeds the 1% threshold. You’d need to repeat the test twice and average all three results. If the average is 1.0% or less, the batch may still pass.
5. Safe Margin Example
- Initial weight (W₁): 5.00 g
- Final weight (W₂): 4.96 g
Friability (%) = ((5.00 - 4.96) / 5.00) × 100 = 0.80%
Result: Pass → A typical, well-performing batch.
Acceptance Criteria You Should Know
To know whether your tablets pass the friability test, compare your results against these standard acceptance rules:
- Weight loss should not exceed 1.0%: If the calculated friability percentage is 1.0% or less, the tablets are generally acceptable.
- Test is run once in most cases: Only repeat the test if the first result is borderline or unclear.
- If repeated, average the results: When repeating the test, perform two more trials and calculate the mean of all three. The average must still be ≤1.0%.
- Visible tablet damage means failure: Cracked, cleaved, or broken tablets automatically fail the test — no matter what the weight loss percentage shows.
- Special tablet types may follow different limits: Effervescent, chewable, or unusually shaped tablets might require adjusted criteria. Always refer to the product-specific guidelines.
- Documentation matters: Record all results, including visual observations and retest conditions. Accurate records help justify compliance decisions.
Avoid These Common Mistakes
Even though the friability test formula is straightforward, small errors in execution can lead to inaccurate results. Here’s what you need to watch for if you want consistent, reliable outcomes:
- Mixing up W₁ and W₂ :Reversing the initial and final weights will completely distort your calculation. Always double-check before applying the formula.
- Skipping the dedusting step: If you don’t remove dust from the tablets before and after testing, the weight difference may be exaggerated — giving you a false fail.
- Starting with damaged tablets: Using chipped, cracked, or broken tablets in the initial sample automatically compromises your test and can invalidate the result.
- Using the wrong sample size: Make sure your sample is at least 6.5 g or 10 tablets, depending on the tablet weight. Smaller samples won’t give representative data.
- Running the friabilator at the wrong speed or count: The standard is 25 ±1 rpm for exactly 100 rotations. Deviating from this affects both test accuracy and reproducibility.
- Ignoring the drum’s condition or setup: Tablets should tumble freely inside a smooth drum. If they stick or clump, tilt the drum 10° to improve movement.
- Allowing moisture to affect tablets during the test: Environmental factors like humidity can cause weight gain instead of loss. Always test in controlled temperature and humidity.
- Skipping equipment calibration: Make sure the balance, rotation timer, and drum mechanism are properly calibrated. Even slight errors can skew results.
- Failing to retest borderline batches: If your result is close to the 1.0% limit, repeat the test two more times and average all three values to confirm compliance.
Achieving Reliable Test Results with Torontech
The friability calculation remains the industry standard for verifying if your tablets have the physical strength to survive the supply chain. It allows you to confirm that your product will endure the rigors of shipping and warehousing without cracking or reducing to powder.
By sticking to established protocols and steering clear of typical errors, you ensure your lab data is solid, leading to smarter production choices. If you are looking to upgrade your laboratory configuration, examine our friability testing stations. They are engineered to deliver exactness and uniformity across every single run.
Need help selecting the right model? Every laboratory has unique throughput requirements. Speak with our technical team today to find a testing station that fits your specific volume and budget.
References
- Osei-Yeboah, F., & Sun, C. (2015). Validation and applications of an expedited tablet friability method. International journal of pharmaceutics, 484 1-2, 146-55.
- Watts, C., & Dexter, A. (1998). Soil friability: theory, measurement and the effects of management and organic carbon content. European Journal of Soil Science, 49.
- Torisu, T., Maruno, T., Yoneda, S., Hamaji, Y., Honda, S., Ohkubo, T., & Uchiyama, S. (2017). Friability Testing as a New Stress-Stability Assay for Biopharmaceuticals.. Journal of pharmaceutical sciences, 106 10, 2966-2978.
- Schiano, S., Wu, C., Mirtič, A., & Reynolds, G. (2016). A novel use of friability testing for characterising ribbon milling behaviour.. European journal of pharmaceutics and biopharmaceutics : official journal of Arbeitsgemeinschaft fur Pharmazeutische Verfahrenstechnik e.V, 104, 82-8.
- Munkholm, L. (2011). Soil friability: A review of the concept, assessment and effects of soil properties and management. Geoderma, 167, 236-246.
- , B. (2023). Physicochemical and In-Vitro Bioequivalence Analysis of Some Oral Solid-Dosage Metronidazole Formulations. Bioequivalence & Bioavailability International Journal.
- Campanac, R. (1975). SAND FRIABILITY TEST.


