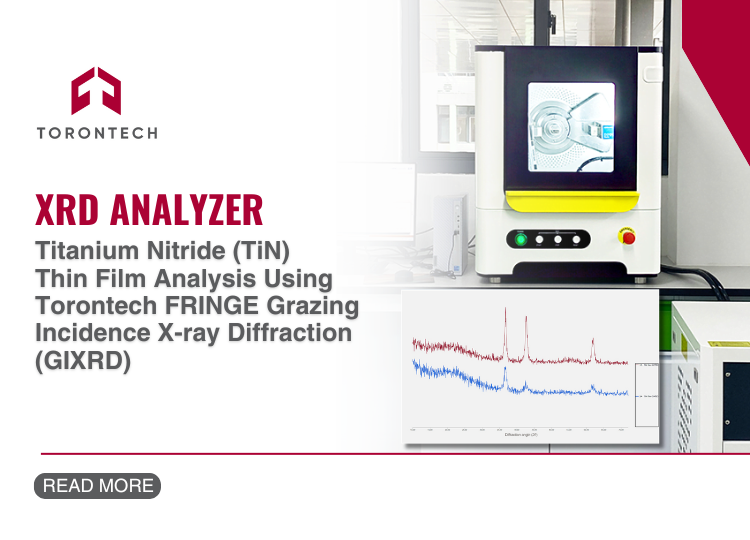
Understanding the structure and crystallinity of ultra-thin Titanium Nitride (TiN) coatings is crucial for quality control and product performance, especially in microelectronics, optics, and surface engineering. This article explores how Torontech’s Benchtop XRD Analyzer – X-ray Diffractometer – FRINGE Family, using Grazing Incidence X-ray Diffraction (GIXRD), provides accurate phase analysis and crystallinity data for TiN films on silicon wafers, even at nanoscale thicknesses.
Why Titanium Nitride (TiN) Films Matter
Titanium Nitride (TiN) coatings are widely used in microelectronics, hard coatings, and biomedical devices due to their extreme hardness, corrosion resistance, thermal stability, and low electrical resistivity. Their unique golden hue is an added advantage in decorative and optical applications.
With the growing demand for high-performance materials, analyzing the structural properties of TiN films becomes essential during both R&D and production. Grazing incidence X-ray diffraction is a key method in thin film characterization, especially when traditional XRD techniques fail to isolate the film signal from the substrate.
Crystal Structure and Material Properties of TiN Films
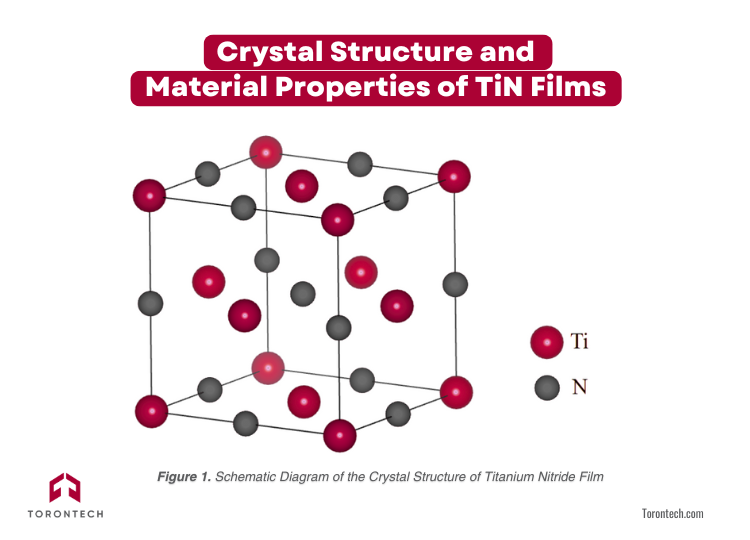
TiN and Ti₂N are two primary phases of titanium nitride compounds. In TiN, titanium atoms are arranged in a face-centered cubic (FCC) structure with nitrogen atoms occupying the octahedral interstitial sites. This NaCl-type crystal structure contributes to TiN’s excellent mechanical and physical properties. The lattice constant of TiN at room temperature is approximately 0.424 nm, with a {110}<110> slip system and a theoretical density of 5.339 g/cm³.
Understanding the crystallographic properties of TiN films is vital for optimizing deposition parameters and improving film performance across various applications.
Why Use FRINGE Grazing Incidence X-Ray Diffraction (GIXRD) for Titanium Nitride Film Characterization?
Traditional X-ray diffraction (XRD) techniques often struggle to isolate the signal of ultra-thin films due to interference from the substrate material. This is especially true when the film thickness is significantly smaller than the X-ray penetration depth.
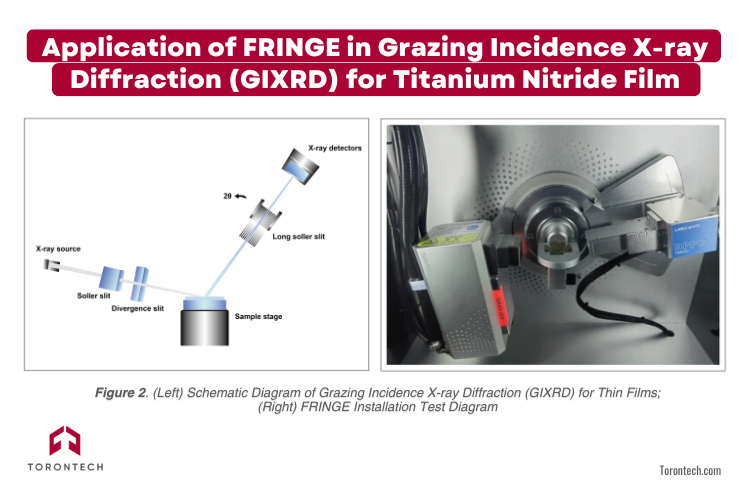
Grazing Incidence X-ray Diffraction (GIXRD) solves this issue by setting a low angle of incidence (typically 1°), allowing X-rays to interact primarily with the surface layer. This method greatly enhances the signal-to-noise ratio for thin films, providing accurate phase identification and crystallinity analysis.
The Torontech FRINGE Desktop X-ray Diffractometer is specifically designed for high-precision X-ray diffraction analysis of thin films. Equipped with advanced sample handling and alignment features, it is ideal for research labs and industrial quality control departments requiring detailed structural analysis.
Case Study: TiN Film Testing Using Torontech FRINGE
A. Sample Information for TiN Films
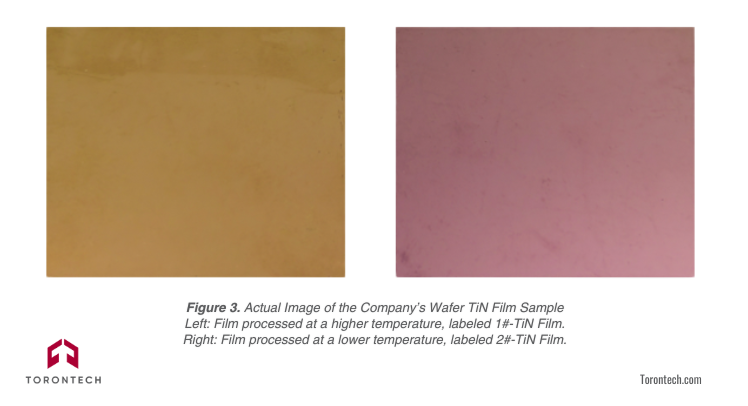
Two wafer-based samples were prepared with the same base structure (60 nm TiN / 400 nm SiO₂ / Si substrate) but subjected to different annealing temperatures:
-
Sample 1#: High-temperature processed TiN film
-
Sample 2#: Low-temperature processed TiN film
B. Instrument Setup – Torontech FRINGE Parameters
| Parameter | Value |
|---|---|
| Scanning Modes | θ–θ and GIXRD (1° incidence) |
| Range | 10°–75° (θ–θ), 10°–72° (GIXRD) |
| Step Size | 0.05° per step |
| Sampling Time | 200 ms (θ–θ), 500 ms (GIXRD) |
| Voltage/Current | 30 kV / 20 mA |
| Radiation Source | Cu Target (CuKα) |
| Accessories | Focusing filter, long soller slit, adjustable Z-stage |
C. Key Results from GIXRD Analysis
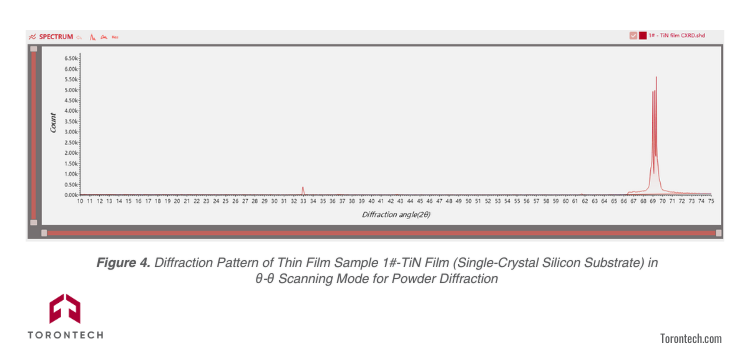
1. Conventional θ–θ Scanning
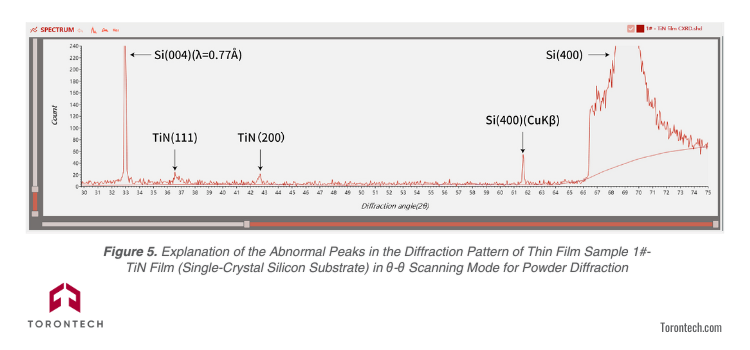
In standard θ–θ mode, diffraction peaks from the silicon substrate dominated the pattern. The TiN (400) peak at 69.2° appeared distorted due to interference, highlighting the limitations of traditional XRD for ultra-thin films.
2. GIXRD Mode for Surface-Sensitive Characterization
GIXRD successfully isolated the TiN film signals, confirming:
-
Phase composition: Both samples consist of TiN with FCC structure (PDF Card No. 00-038-1420).
-
Orientation: Sample 2# exhibited a strong (200) preferred orientation.
-
Crystallinity: Higher annealing temperature improved crystallinity. Sample 1# showed sharper diffraction peaks than Sample 2#.
3. Crystallinity Analysis Based on Processing Temperature
Using grazing incidence X-ray diffraction (GIXRD), the crystallinity of two TiN film samples was evaluated. The results clearly show that higher processing temperatures lead to improved crystallinity.
| Film Sample Number | Processing Temperature | Amorphous Peak Area | Total Area | Crystallinity (%) |
|---|---|---|---|---|
| 1# TiN film | High | 2346 | 5455 | 57 |
| 2# TiN film | Low | 2749 | 3880 | 36 |
The higher crystallinity in Sample 1# is attributed to the elevated processing temperature, which promotes better crystal growth and alignment. In contrast, Sample 2# exhibited a higher amorphous peak area and reduced overall crystallinity.
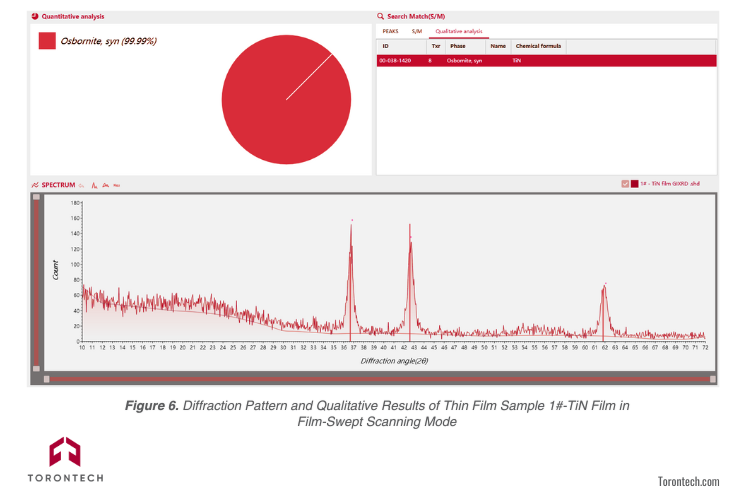
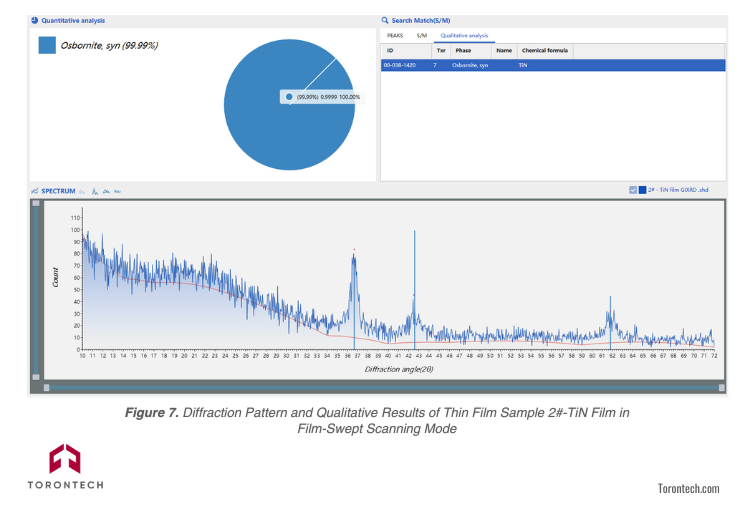
4. Diffraction Pattern and Qualitative Results
a. Sample 1#-TiN Film in Film-Swept Scanning Mode
b. Sample 2#-TiN Film in Film-Swept Scanning Mode
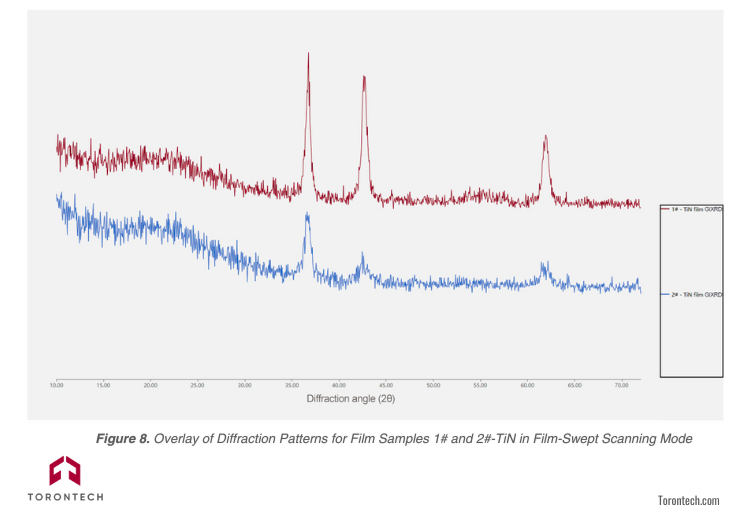
c. Overlay of Diffraction Patterns for Film Samples 1# and 2#-TiN in Film-Swept Scanning Mode
5. Analysis Summary
a. Dual Diffraction Geometries Utilized
Two X-ray diffraction geometries were applied for TiN film evaluation. In the conventional symmetric diffraction mode (CXRD), the sample remains stationary while both the X-ray tube and detector rotate at θ angles. In contrast, the grazing incidence X-ray diffraction (GIXRD) method maintains a fixed 1° angle of incidence, with the detector scanning across a wide 2θ range. This approach minimizes substrate interference and enhances surface-sensitive analysis (see Fig. 2).
b. Substrate Interference in θ–θ Mode
As shown in Fig. 4, the θ–θ scan of Sample 1# (TiN on a single crystal silicon substrate) displays a prominent 400 diffraction peak at 69.2° (2θ), distorted by strong signal intensity. Figure 5 further reveals a secondary peak near 33°, attributed to the Si(002) plane, illustrating the limitations of traditional XRD for thin film-only characterization.
c. Phase Identification and Orientation via GIXRD
Figures 6 and 7 present the GIXRD patterns of Samples 1# and 2# TiN films. Both samples exhibit a face-centered cubic (FCC) crystal structure, confirmed by reference PDF card #00-038-1420. The results indicate complete phase formation of TiN. Notably, Sample 2# demonstrates a (200) preferred orientation, suggesting temperature-induced structural alignment.
d. Crystallinity Comparison and Thermal Influence
Figure 8 overlays the GIXRD patterns of both samples. Sample 1#, processed at a higher temperature, shows sharper and more intense diffraction peaks, indicating enhanced crystallinity. Quantitative evaluation using split-peak fitting software revealed crystallinity values of 57% for Sample 1# and 36% for Sample 2# (see Table 1). This confirms that higher thermal treatment improves film ordering and grain structure.
Conclusion
The Torontech FRINGE Desktop X-ray Diffractometer, equipped with dedicated film analysis accessories, enables precise evaluation of thin film materials through grazing incidence X-ray diffraction (GIXRD). By isolating the surface layer signal, FRINGE allows for reliable characterization of crystal structure, phase composition, and crystallinity in nanometer-scale coatings like Titanium Nitride (TiN).
This level of accuracy supports advanced materials research, process optimization, and production quality control, empowering engineers and scientists to make informed adjustments for improved product performance and consistency.