It’s a common challenge: obtaining a clean TGA curve is one thing, but the interpretation of a TGA curve and what it really means for your materials is another task entirely. You receive a graph with a descending line, and from that, you need to extract critical information about your material’s composition and thermal performance.
This guide will walk you through how to interpret a TGA curve, the factors that can influence your results, and how this TGA analysis can be used to ensure your products meet a high standard of quality.
The Purpose of a TGA Curve and Its Business Impact
In essence, a TGA curve tracks the weight of your material, moment by moment, as it’s heated in a controlled environment. The resulting graph shows you precisely when and how much mass the sample loses as the temperature rises.
But that simple line holds a wealth of actionable information. For professionals working with materials, this analysis reveals the real story:
- For Plastics and Polymer Professionals: It allows you to quantify the exact amounts of polymer, filler, and other additives within a sample. This makes it possible to quickly verify if a supplier’s formulation meets your specifications.
- For Pharmaceutical Applications: TGA is an essential tool for checking the thermal stability of a new drug or ensuring residual moisture and solvents are within acceptable limits. It serves as a highly efficient quality check.
- For Quality Control Teams: This can be your most effective tool. You can run a curve on a reference sample, then test a new batch. If the curves don’t align, you can identify a potential problem long before it impacts production.
How to Read a TGA Curve: A Detailed Breakdown
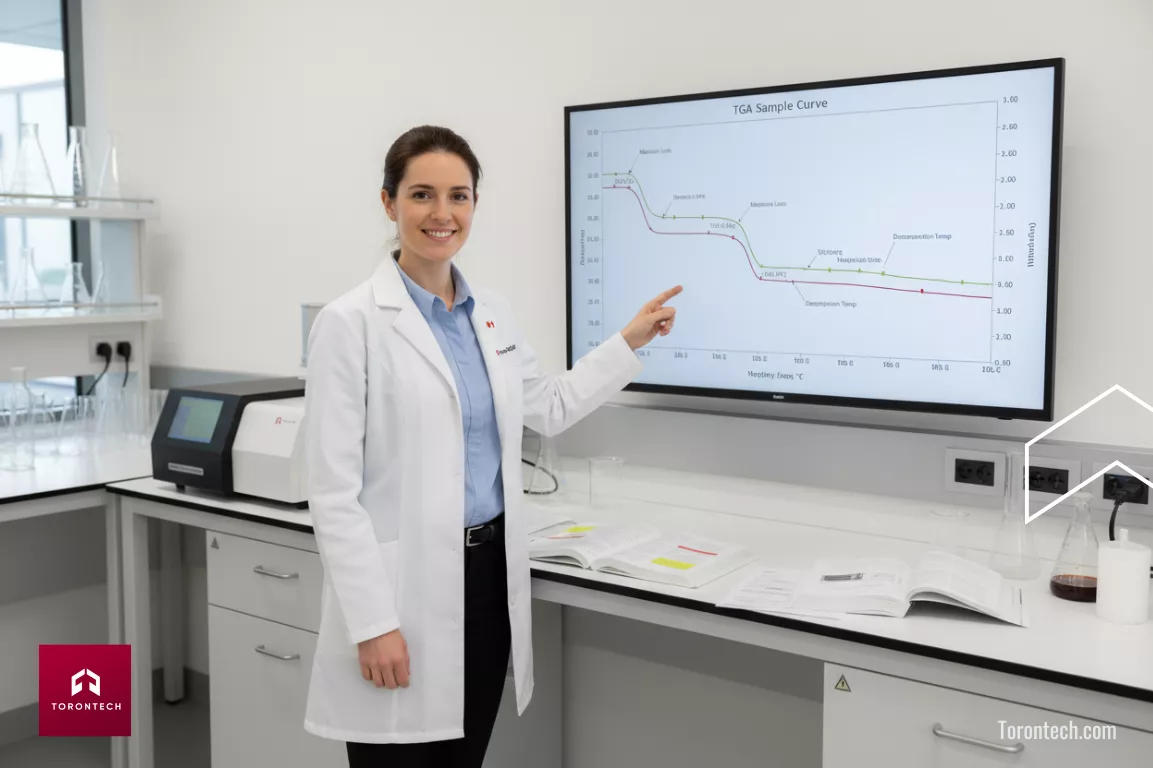
The complete thermal story of your material is contained in the shape of this curve. A proper interpretation of the TGA curve allows you to deconstruct a material’s composition and stability piece by piece.
The Initial Plateau: Establishing the Baseline
This is the flat line at the beginning of the analysis, representing the sample’s stable, initial mass. It establishes the 100% baseline for all subsequent calculations. This region is also useful for a quick check: a small, early drop around 100°C is a strong indication of surface moisture, an important first step in learning how to read a TGA curve.
The Onset of Mass Loss: A Measure of Stability
The temperature where the curve begins its first significant drop is the onset temperature. This is a critical metric for thermal stability. If you are comparing two materials, the one with the higher onset temperature is generally more robust. For example, a sample of polypropylene might show an onset around 350°C.
Mass Loss Steps: Quantifying the Composition
The distinct, sharp drops in the curve are a core part of the TGA curve interpretation. The number of steps tells you how many different components are decomposing. The size of each step tells you exactly how much of that component was in your sample.
Let’s look at two examples:
- Simple Case (1 Step): Filled Polypropylene. A polypropylene sample with 30% calcium carbonate filler will show one large mass loss step. This drop, occurring between roughly 350°C and 500°C, represents the decomposition of the polypropylene polymer itself.
- Complex Case (2 Steps): PVC. A material like PVC (Polyvinyl Chloride) shows a more complex, two-step decomposition. The first sharp drop is the loss of hydrochloric acid (HCl), while the second, later drop is the breakdown of the remaining carbon structure.
The quantitative information is direct: if a mass loss step accounts for a 60% drop in the total mass, then that component made up 60% of the sample’s weight.
The Final Residual Mass: Identifying What’s Left
After all decomposition events are complete, the curve settles into a final flat line. This remaining mass is the non-combustible residue, often an inorganic filler like calcium carbonate or glass fibers. In our polypropylene example, the curve would flatten out at 30% on the mass axis, telling us that 30% of the material was filler.
Putting It All Together: Comparing Curves
The real power of TGA in a business context comes from overlaying curves. You can run a test on a trusted “golden standard” batch and then a new batch. Any deviation is an immediate visual confirmation that the new batch does not meet the required specification.
Advanced TGA Curve Interpretation: Using the DTG Curve
While the TGA curve shows you how much mass was lost, the first derivative curve—the DTG curve—shows you how fast it was lost. This graph plots the rate of mass loss against temperature and is essential for a more advanced interpretation of the TGA curve.
- Solving Ambiguity: Imagine a TGA curve where two components decompose at similar temperatures, looking like one long slope. The DTG curve solves this by showing two separate peaks, allowing you to clearly distinguish between the two events.
- Pinpointing a Precise Temperature: Each peak on the DTG curve corresponds to the point of maximum reaction rate. This temperature (T_peak) is a highly reproducible characteristic, often more precise than the TGA onset temperature for quality control.
- Analyzing Peak Characteristics: The shape of a DTG peak tells a story. A tall, sharp peak indicates a rapid decomposition, while a short, broad peak signifies a slower process. The area under each peak is also directly proportional to the mass lost, making it an excellent tool for quantification.
Factors Affecting TGA Curve Results
A clean, reproducible result is the goal, and understanding the factors affecting a TGA curve is critical. Inaccurate TGA curve interpretation can often be traced back to these variables.
- Your Heating Rate: Heating the sample too quickly can obscure thermal events. A more controlled rate provides a clearer picture with better resolution.
- The Sample Itself: The way a sample is prepared matters. A large, solid piece will behave differently than a fine powder. Consistency is key for obtaining comparable results.
- The Atmosphere Inside: The gas used during the test has a major impact. An inert gas like nitrogen allows you to study pure thermal decomposition, while a reactive gas like air is used to assess oxidative stability.
Common Artifacts in TGA Data
At times, instrumental effects can create artifacts that lead to an incorrect interpretation of a TGA curve. Being aware of these helps prevent misinterpretation.
- The Buoyancy Effect: A slight upward drift in the curve at the start is not a weight gain, but a gas density effect. This is easily corrected by running a baseline test with an empty pan and subtracting it from your results.
- Sample Ejection: A rapid decomposition can cause sample to pop out of the crucible, creating a sudden drop in mass that is not a thermal event. Using a crucible lid can often prevent this.
- Sample Foaming: Certain materials can foam when heated and make contact with the weighing mechanism, leading to a noisy and unreliable signal. Using a smaller sample size can typically resolve this issue.
Get Trusted TGA Results with Torontech
Mastering TGA curve interpretation is the first step to leveraging this powerful technique. When you can trust your analysis, you can make better decisions, improve product quality, and verify incoming materials with certainty.
At Torontech, we focus on building high-performance, cost-effective laboratory instruments. Our TGA Thermogravimetric Analyzers are engineered to provide the precise, reliable data you need without the high price point.
If you are looking to improve your lab’s material analysis capabilities, we invite you to explore our TGA solutions or contact our team to discuss your specific applications.
Want More Reliable TGA Results?
References:
- Aniza, R., Chen, W., Kwon, E., Bach, Q., & Hoang, A. (2024). Lignocellulosic biofuel properties and reactivity analyzed by thermogravimetric analysis (TGA) toward zero carbon scheme – A critical review. Energy Conversion and Management: X. https://doi.org/10.1016/j.ecmx.2024.100538
- Álvarez, A., Pizarro, C., García, R., Bueno, J., & Lavín, A. (2016). Determination of kinetic parameters for biomass combustion. Bioresource technology. https://doi.org/10.1016/j.biortech.2016.05.039
- Mohalik, N., Mandal, S., Ray, S., Khan, A., Mishra, D., & Pandey, J. (2021). TGA/DSC study to characterise and classify coal seams conforming to susceptibility towards spontaneous combustion. International Journal of Mining Science and Technology. https://doi.org/10.1016/j.ijmst.2021.12.002
- Xiang, S., Lidong, F., Bian, X., Li, G., & Chen, X. (2020). Evaluation of PLA content in PLA/PBAT blends using TGA. Polymer Testing. https://doi.org/10.1016/j.polymertesting.2019.106211
- Akash, M., & Rehman, K. (2019). Thermo Gravimetric Analysis. https://doi.org/10.1007/978-981-15-1547-7_19
- Coimbra, R., Escapa, C., & Otero, M. (2019). Comparative Thermogravimetric Assessment on the Combustion of Coal, Microalgae Biomass and Their Blend. Energies. https://doi.org/10.3390/EN12152962
Frequently Asked Questions (FAQ)
1. What is the first step in TGA curve interpretation?
The first step in TGA curve interpretation is to identify the main mass loss steps on the y-axis. Look for distinct vertical drops in the curve. The initial flat plateau represents the sample’s starting weight (100%), and each step down corresponds to a specific component decomposing. The final plateau at the end of the test shows the percentage of non-combustible residue, such as ash or fillers.
2. How do you find the decomposition temperature on a TGA curve?
The decomposition temperature is typically identified as the “onset temperature,” which is the point on the x-axis where a significant mass loss begins. For a more precise and reproducible measurement, analysts often use the DTG (Derivative Thermogravimetry) curve, where the peak of the curve indicates the temperature of the maximum decomposition rate.
3. What does a single sharp drop in a TGA curve mean?
A single, sharp drop in a TGA curve usually indicates the decomposition of the main component of a relatively pure material. The sharpness of the drop suggests that the decomposition happens quickly over a narrow temperature range. The size of this drop directly tells you the percentage of that component in the sample.
4. What are the most common factors affecting a TGA curve?
The three most common factors affecting a TGA curve are the heating rate, sample preparation, and the furnace atmosphere. A faster heating rate can shift events to higher temperatures. The sample’s mass and particle size can affect heat transfer. Finally, an inert atmosphere (like nitrogen) is used for thermal stability tests, while a reactive atmosphere (like air) is used to study oxidative stability.
5. How does a DTG curve help you interpret a TGA curve better?
A DTG curve helps you interpret a TGA curve better by clearly separating overlapping events. Where a TGA curve might show a single long, sloping mass loss, the DTG curve will show two or more distinct peaks. This allows you to accurately identify and quantify individual components that decompose at similar temperatures.

